The Sugar/Oil Ratio: How to Use It to Anticipate Price Moves
May 18, 2026·3 min read
The Sugar/Oil Ratio: How to Use It to Anticipate Price Moves
When we study the relationship between two commodities, our first instinct is to look at their correlation. However, this approach has limitations, especially when examining day-to-day relationships.
We try to look for statistics that confirm what we are experiencing currently, but more often than not, it is not possible to create a statistical model that reflects how we are feeling about the market.
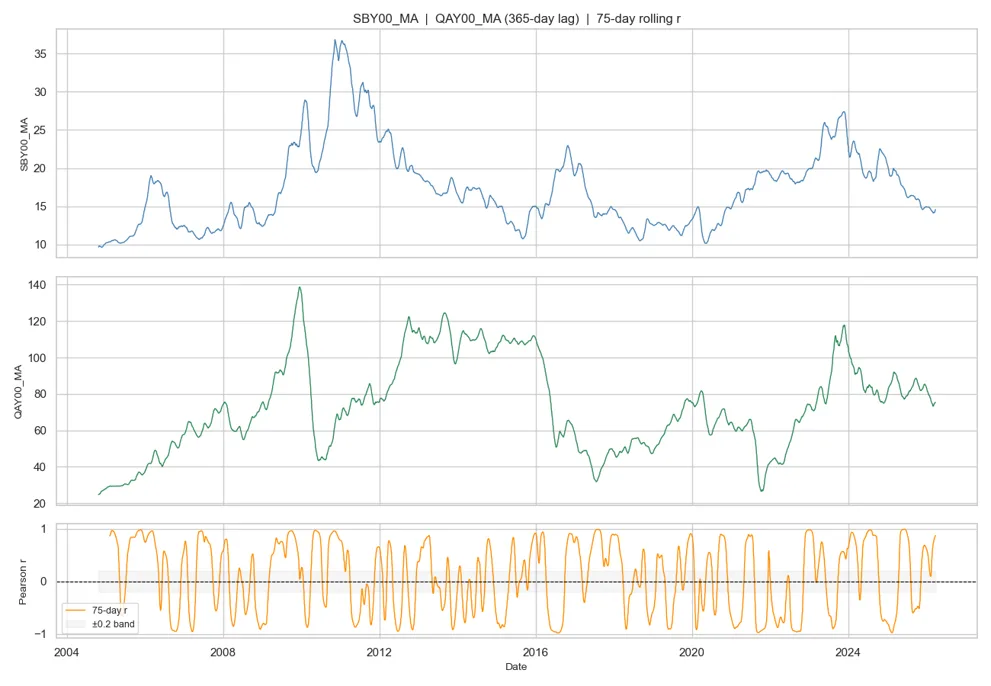
If I told you: "oil prices have an influence in sugar prices", you'd probably say: "no, look oil has been rising for weeks and sugar is just choppy after having made a 52 week low".
What if we are both correct?
If I brought your attention to the 75-day rolling correlation, we could come to the conclusion that we can both be right at different times, because correlation is not static.
But then, what is the point of calculating a correlation if it is not stable?
Enter the Sugar/Oil Ratio.
When we divide the price of sugar by the price of oil, we get the purchasing power of sugar in terms of oil. In other words, how much oil we can buy with one unit of sugar. It becomes a single metric that we can use to do time series analysis and identify trends, ranges, and patterns.
The below image shows the Sugar/Oil Ratio from 1985 to present.
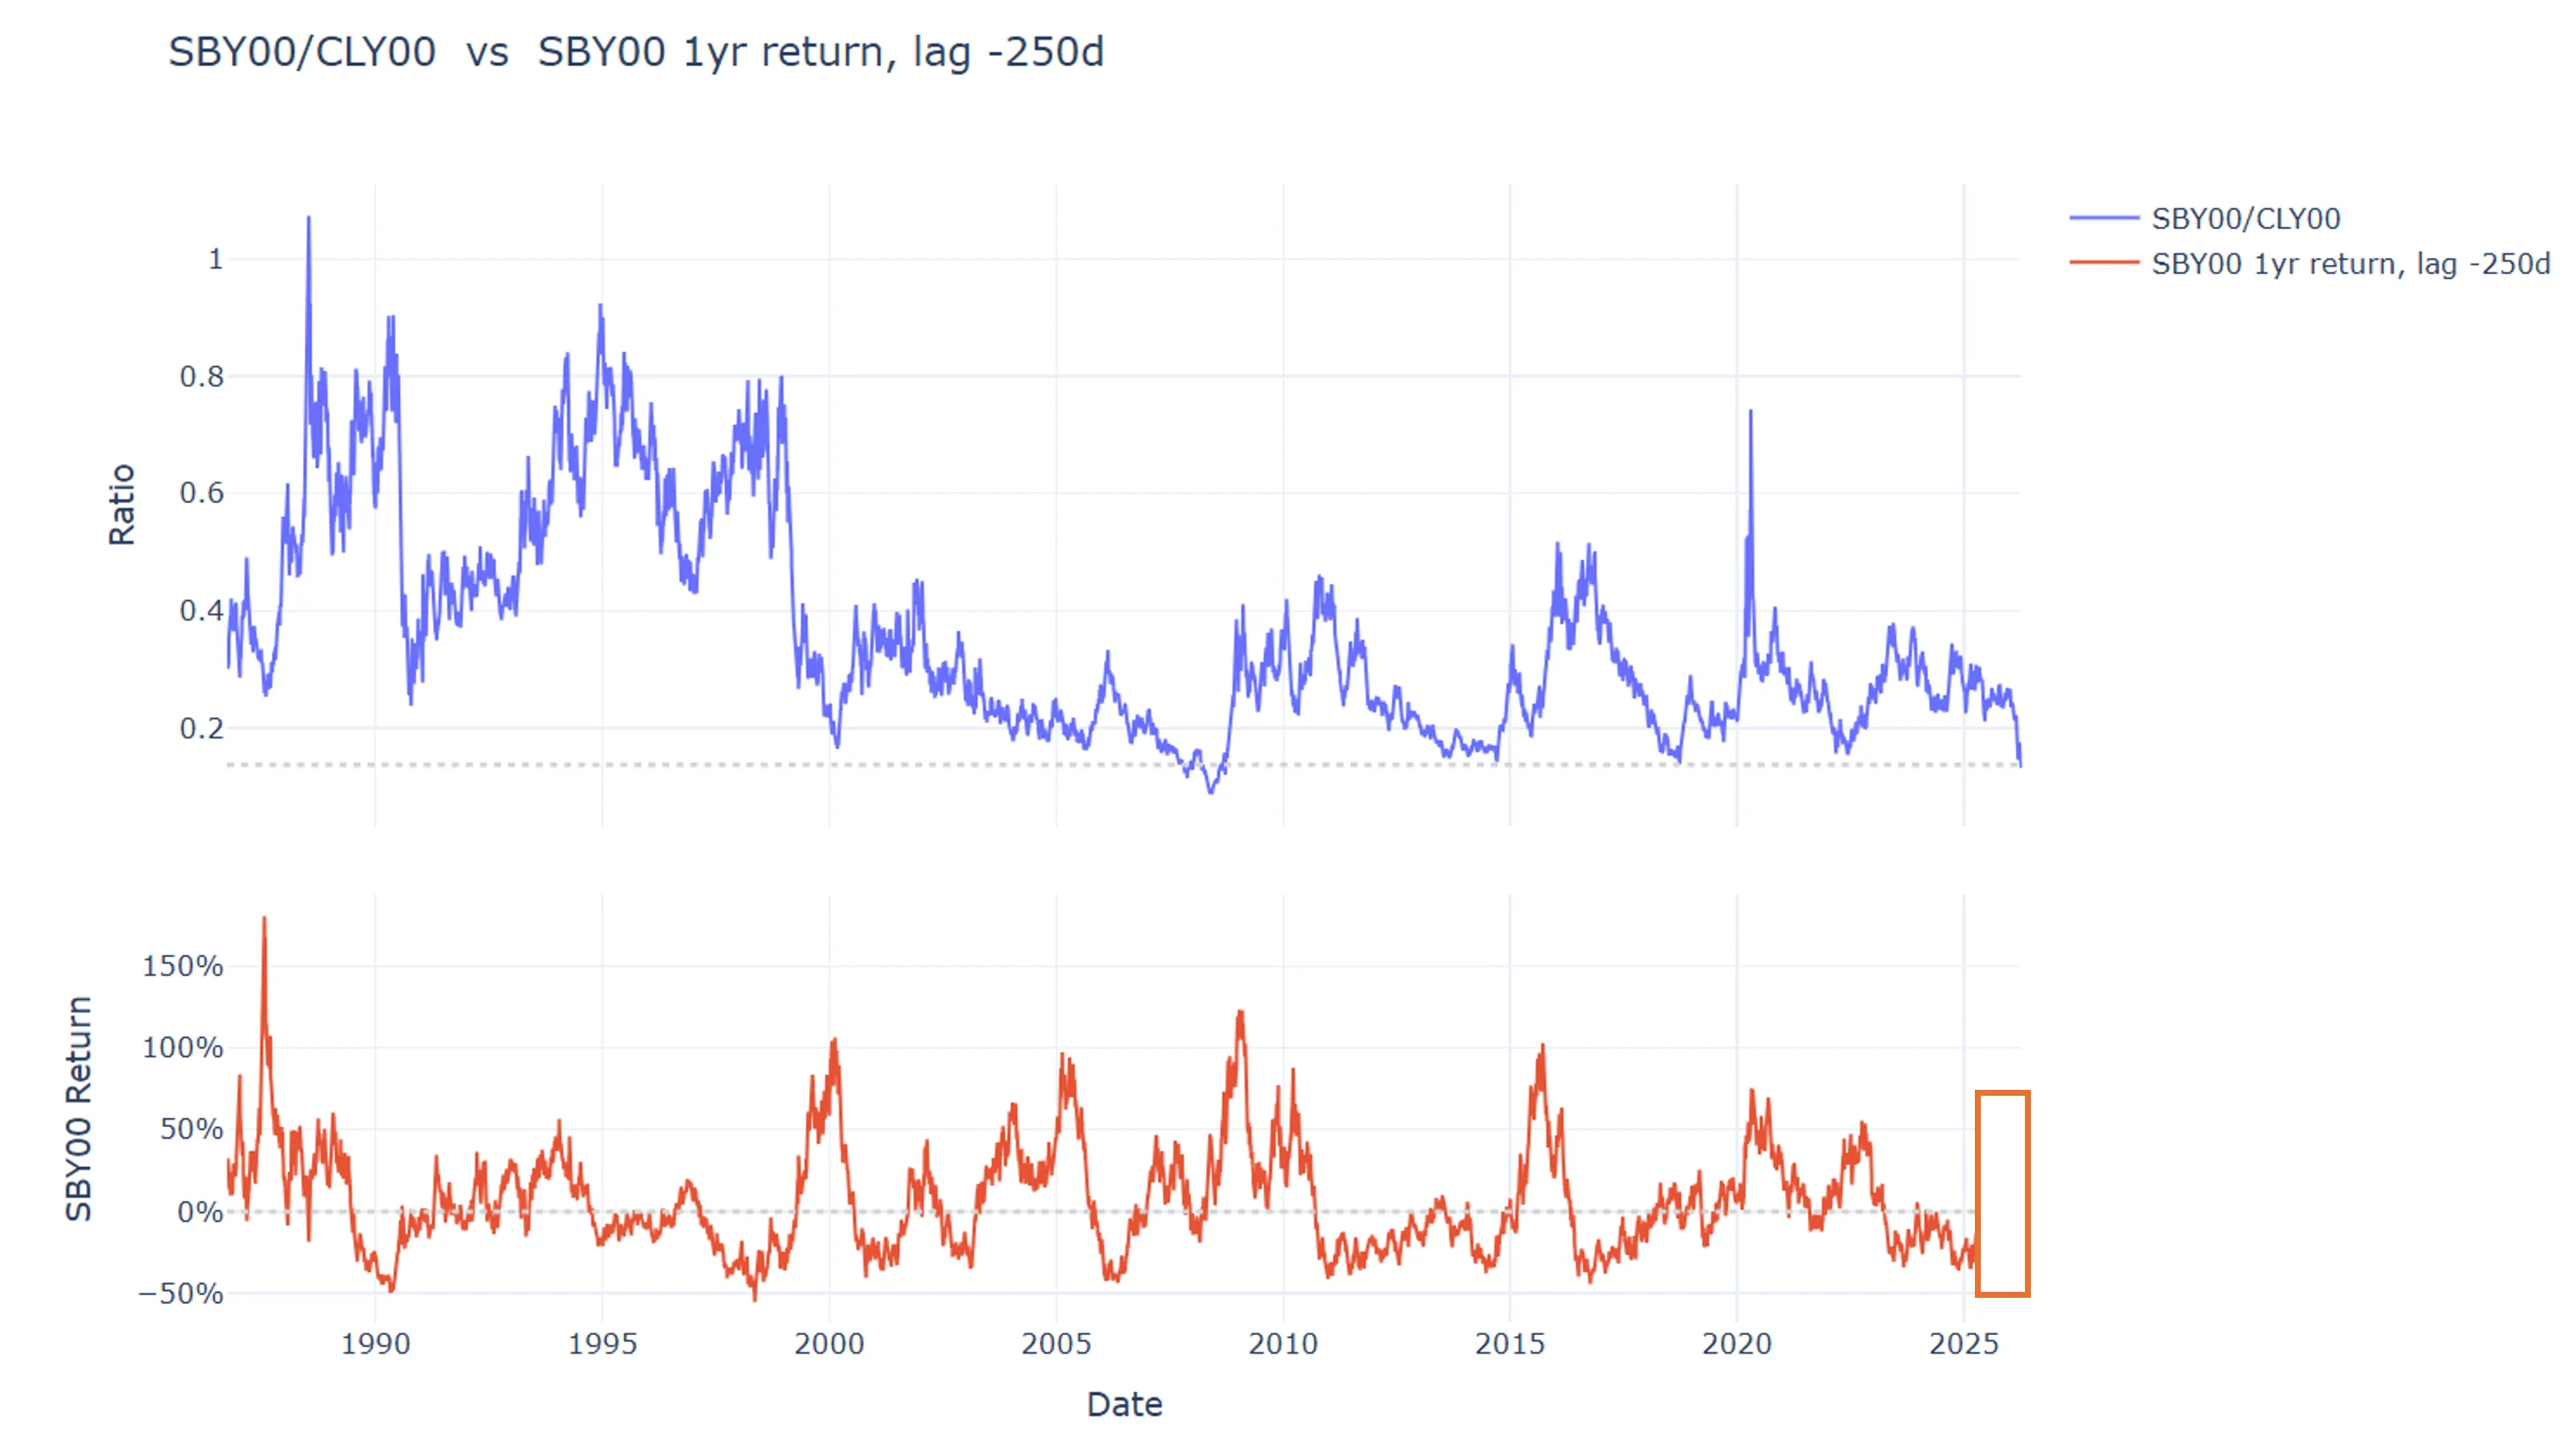
The bottom pane shows the 1-year return of the sugar price with 1-year lag. The red box represents the unknown future return for May 2026 to April 2027 --this article is being written in May 2026. We need to fill in this blank using our imagination. From past experience, what do you think the return will be?
Use this table to help you:
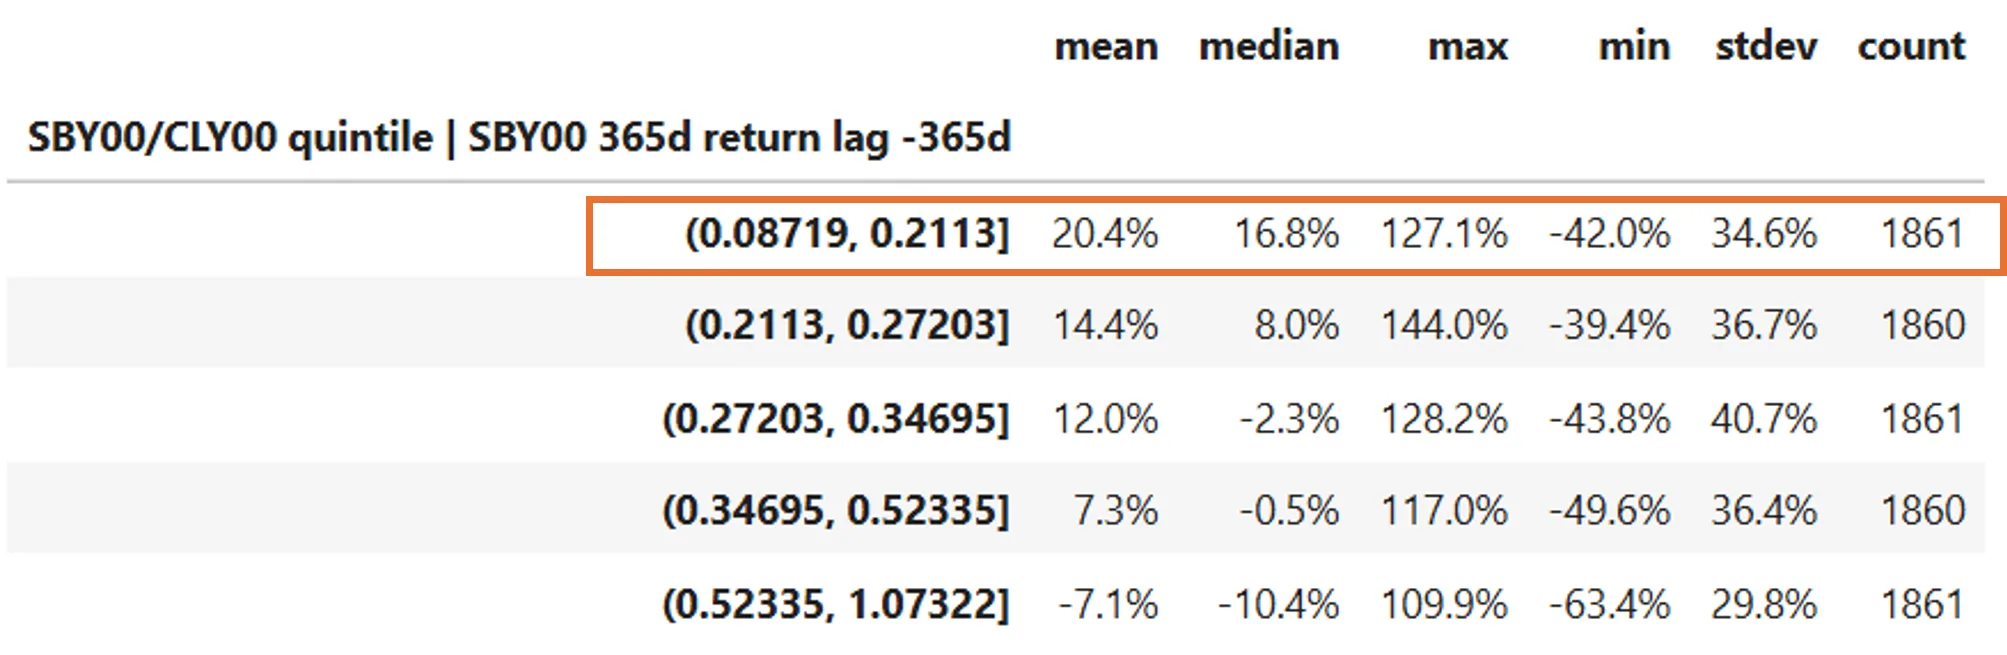
Note something interesting, the lower the ratio, the more likely sugar will experience massive upside. We can see this in the chart, the best years have followed periods of low ratio, except for, maybe 2020, when the oil spike was followed by the sugar spike.
The table also hints at a high "correlation". Without directly calculating correlation, we can see how the mean return of sugar falls as the ratio increases.
This is pretty interesting stuff. Running ratios between commodities is a powerful way to gain insights, especially for the commodity you use as numerator. I feel ratios are not used as much as they should be.
Please review the full presentation here, which is just two slides: